Box Plots with Outliers and Whiskers
The graph shown below makes use of the auto data set which comes with Stata. This graph in particular incorporates the mean, range, inter-quartile range and outliers. This makes the graph very rich and means quite a bit of information can be divined from it.
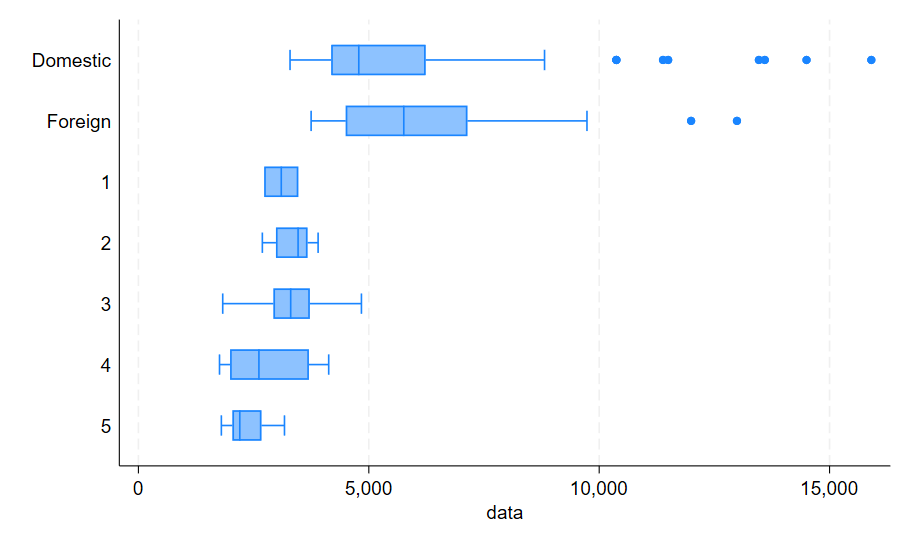
The above graph can be created using the following code:
. sysuse auto, clear

. drop foreign

. generate foreign = rep78 + 1

. append using "`c(sysdir_stata)'//auto.dta"

. label define boxlbl 0 "Domestic" 1 "Foreign" 2 "rep78=1" 3 "rep78=2" 4 "rep78=3" 5 "rep78=4" 6 "rep78=5"

. label values foreign boxlbl

. graph hbox weight, over(foreign)