Colouring Bars in Order of Magnitude
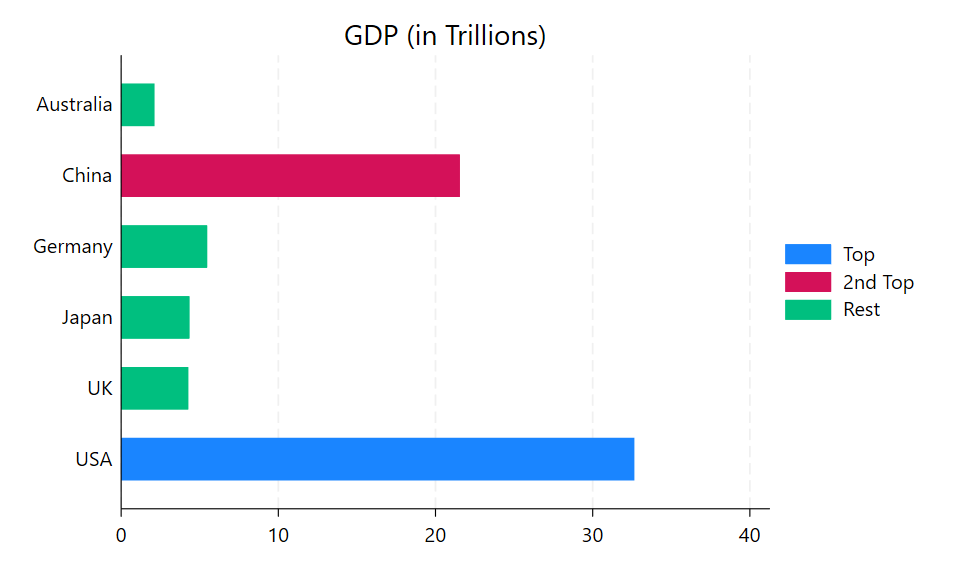
There are times when you may want to highlight the top X number of bars in a bar chart. Usually you want to do this when the bar chart is not ordered in ascending or descending order but in another order that makes sense for that dataset. For example, here we have a bar chart which displays the approximate GDP values of 6 countries in the year 2026. We want the bar chart to have the countries ordered alphabetically, which makes sense but means the GDP values are not ordered sequentially. However, we would still like to draw attention to the top two values in the bar chart as we feel the GDP of these two countries is significant. As it happens, the dataset I have contains a variable called country which records the GDP ranking of each country. This variable also has a value label attached, so each number also displays the country name. I can use the decode command to create a string variable of the country names, and then replace the numeric values of the original country variable so that 1 and 2 remain the same. Anything higher than this will be converted to 3 so they will all be the same colour.
The commands I used are as follows:
webuse set https://techtips.surveydesign.com.au/datasets

webuse topgdp2026.dta, clear

decode country, generate(ctry)

replace country = 3 if country >= 3

label values country .

list

     +--------------------------------------------+
     | country         gdp   gdp_tr~l        ctry |
     |--------------------------------------------|
  1. |       1   3.264e+13      32.64         USA |
  2. |       2   2.155e+13      21.55       China |
  3. |       3   5.471e+12       5.47     Germany |
  4. |       3   4.342e+12       4.34       Japan |
  5. |       3   4.268e+12       4.27          UK |
     |--------------------------------------------|
  6. |       3   2.111e+12       2.11   Australia |
     +--------------------------------------------+

graph hbar (asis) gdp_trill, ///
over(country) over(ctry) ///
stack groupyvars asyvars title("GDP (in Trillions)") ///
legend(label(1 "Top") label(2 "2nd Top") label(3 "Rest"))
This produces the following graph:
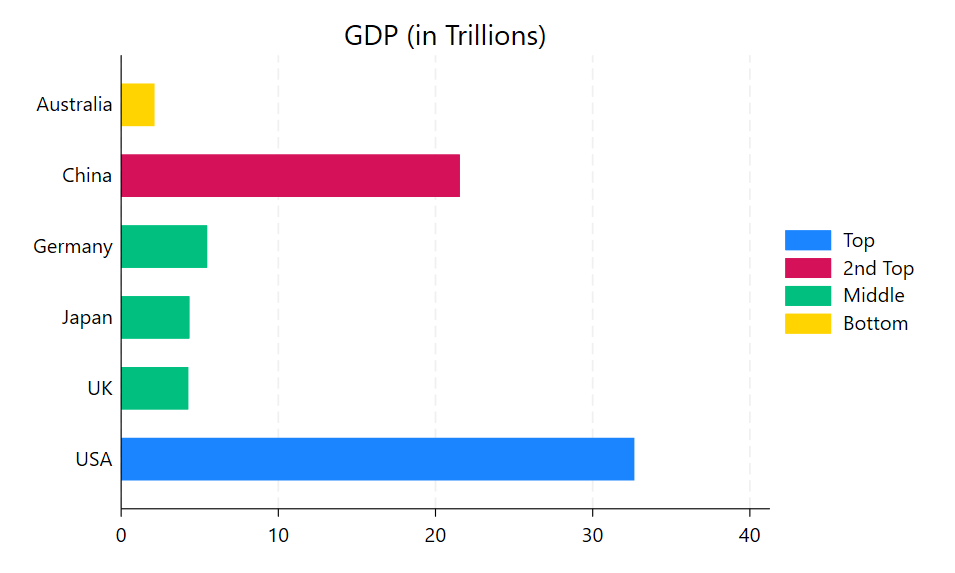
The advantage of this method is that I can choose to number my variable in any way that will highlight what I want. For example, let’s say as well as the top two I want to highlight the lowest GDP in my list. I could do this by designating that country as 4, so everything in between will still appear as the “third” green category. The country variable only requires a small change to do this:
replace country = 4 if ctry == "Australia"

graph hbar (asis) gdp_trill, ///
over(country) over(ctry) ///
stack groupyvars asyvars title("GDP (in Trillions)") ///
legend(label(1 "Top") label(2 "2nd Top") label(3 "Middle") label(4 "Bottom"))
This produces the following graph: