A Cat Plot in Stata
The catplot command will draw graphs to compare two categorical variables with each other. This is similar to what you would see with the tabulate command in Stata, but in graphic form instead of numbers. To draw a categorical plot in Stata you first need to download the catplot command from the SSC with the following command:
ssc install catplot
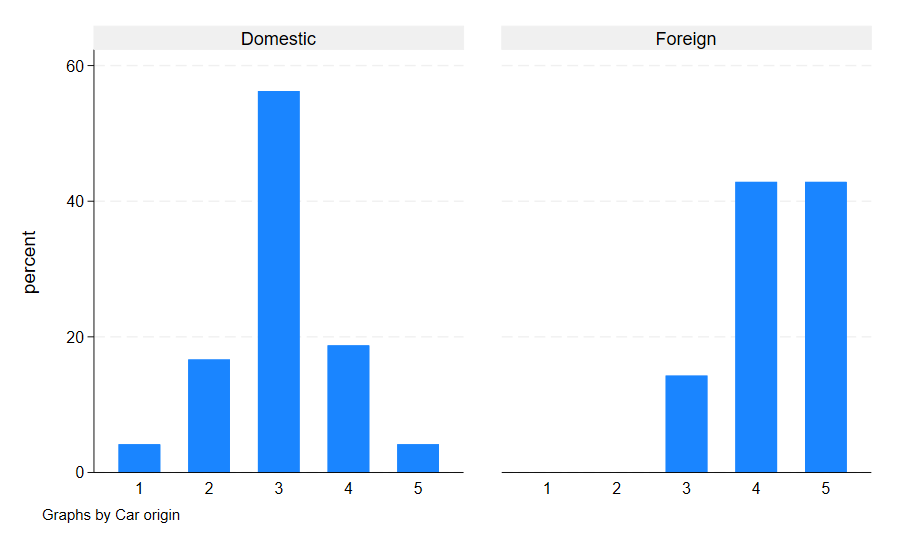
To generate this graph, use the following commands in Stata:
sysuse auto, clear
catplot rep78, by(foreign) percent(foreign) recast(bar)
For a comprehensive exploration of the many Stata graph commands and options, check out the book A Visual Guide to Stata Graphics, 3rd Edition.