A COVID-19 Choropleth Map for New Zealand
In a previous post I covered how to create a choropleth map in Stata using COVID19 data for Australia. In this post I go through how to map the spread in New Zealand. To make these maps I need ESRI shapefiles, which I have obtained for New Zealand through Stats NZ. You will need to create an account with Stats NZ to access their geographic boundary files.
The New Zealand government is recording all infections by District Health Board. To effectively map the infections across New Zealand, I am going to need GIS mapping data of the District Health Boards. I have downloaded these ESRI shapefiles from Stats NZ, and I have saved them in the folder “NZ”, which is located in a folder called “Maps” in my documents folder. The database file (.dbf) and shapefile (.shp) are both called “district-health-board-2015”. I am going to change my current working directory to the NZ folder in Maps, as this makes my analysis easier. If you are using and saving files outside your current working directory you will need to specify the full file path where I use only filenames below. To set up the map data in Stata I use the spshape2dta command as follows:
cd "C:\Users\Laura\Documents\Maps\NZ"
clear
spshape2dta district-health-board-2015
This gives the following output, as expected:
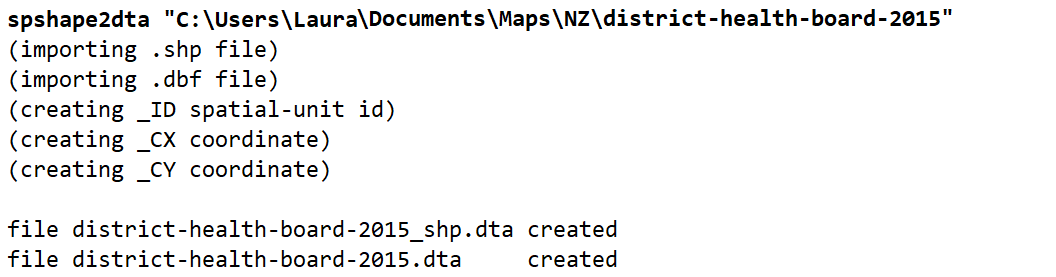
Note: this will save the two files in your current working directory, not the directory the database and shapefiles are saved in. You can move them, however make sure both files are always together in the same folder.
I will test the map data to make sure it works. In the command pane:
use district-health-board-2015.dta, clear
grmap
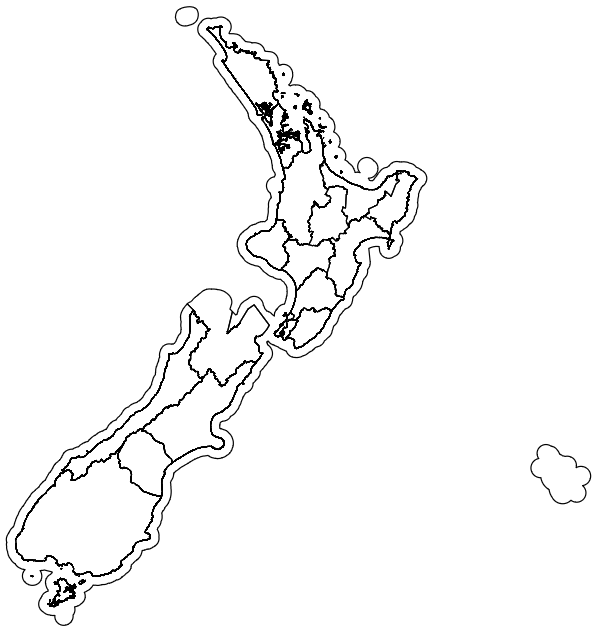
The base map has been correctly imported. Now I need to get the COVID19 data for New Zealand. When I originally made this map during 2020, updated daily data could be obtained from the New Zealand Health Ministry. Now as the pandemic has largely passed, the historic data can be obtained from this Ministry of Health Github dataset. My initial maps were made with data up to 15 April 2020, so I will replicate that with the historic dataset. You can download the original above if you wish, however I have imported and merged the worksheets into a Stata dataset that you can download here.
Now I need to merge this data with my District Health Board map data. Because the historic dataset has daily case numbers and I want the total case numbers up to 15 April 2020, I need to modify the dataset to contain totals up to that date. I will merge the datasets using Stata’s frame commands, rather than the older merge commands.
In the command pane:
clear all
use covidcasesnz.dta
keep if date <= td(15apr2020)
bysort dhb: egen totalcases = total(cases)
keep if date == td(15apr2020)
frame create map
frame change map
use district-health-board-2015.dta
rename DHB2015_Na dhb
drop if dhb == "Area outside District Health Board"
frlink 1:1 dhb, frame(default)
frget totalcases, from(default)
grmap totalcases
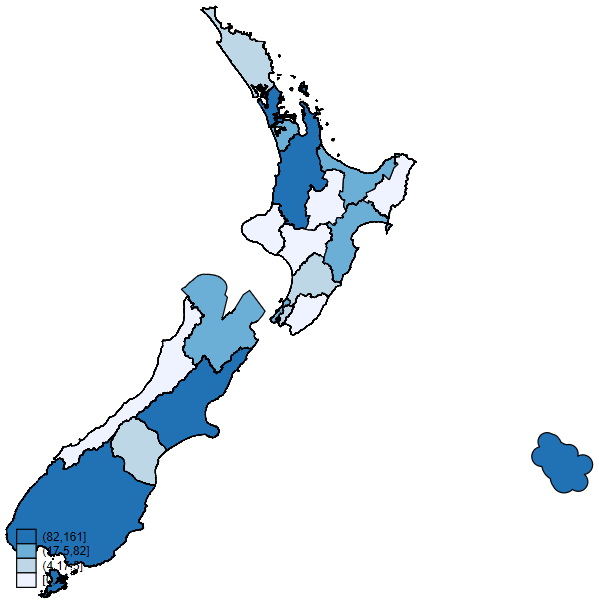
Our map has been drawn correctly, however the legend is currently overlapping the bottom part of New Zealand. Let’s move it. In the command pane:
grmap totalcases, legend(ring(1))
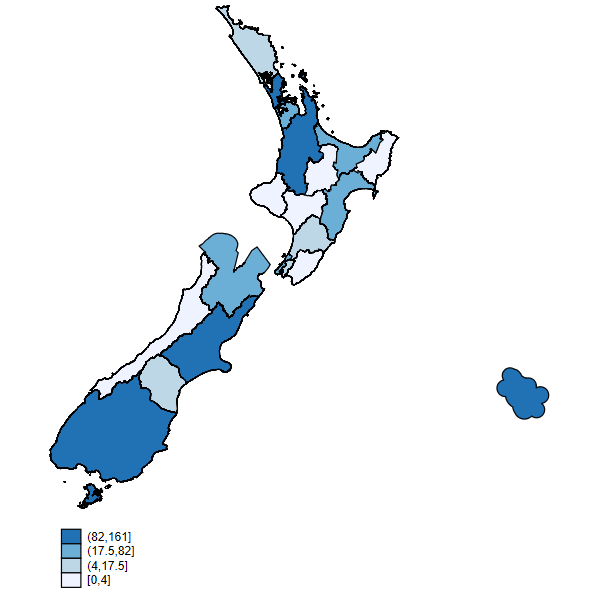
This is much better. If you find that you need to move the legend, a ring value of greater than zero will place the legend outside the confines of the map.
This map is showing infection count data. It does not take into account the different population sizes of the different districts. If we assume that districts with a higher population would also have a higher number of returning travelers, then districts with a bigger population would naturally have a higher number of cases. To account for this, I am going create a new variable that calculates the percent of the population that has contracted the virus per District Health Board. To do this I will need the population data, which is easily obtainable through wikipedia. To get the population data into Stata I use the online tool wikitable. This creates a download link with the population table in a .csv file. I am now going to import that data and attach it to my COVID19 data to generate a new map. In the command pane:
frame create pop
frame change pop
import delimited "C:\Users\Laura\Downloads\District_health_board_1.csv", varnames(1)
rename (name pop) (dhb population)
replace dhb = "Waitemata" if dhb == "Waitematā"
replace dhb = "Tairawhiti" if dhb == "Tairāwhiti"
replace population=subinstr(population, "," ,"",.)
destring population, replace
format population %16.0gc
frame change map
frlink 1:1 dhb, frame(pop)
frget population, from(pop)
generate casespercent = (totalcases/population)*100
grmap casespercent, legend(ring(1))
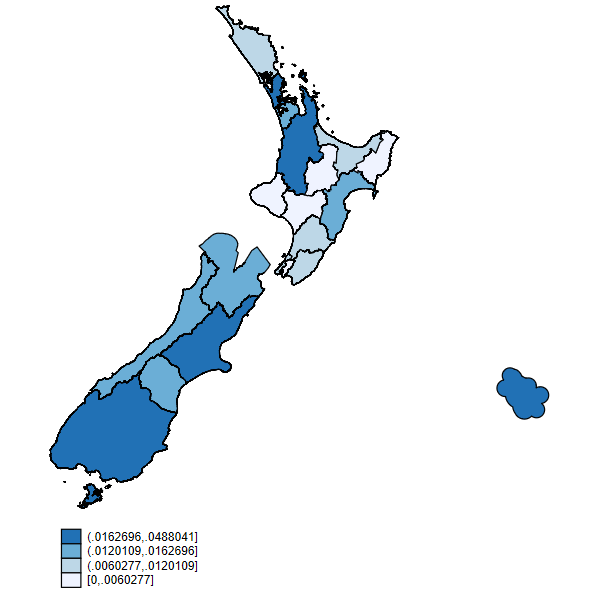
There are a small number of changes from the raw count data, but no District Health Board moves up or down more than one bracket.