A Lexis Plot in Stata
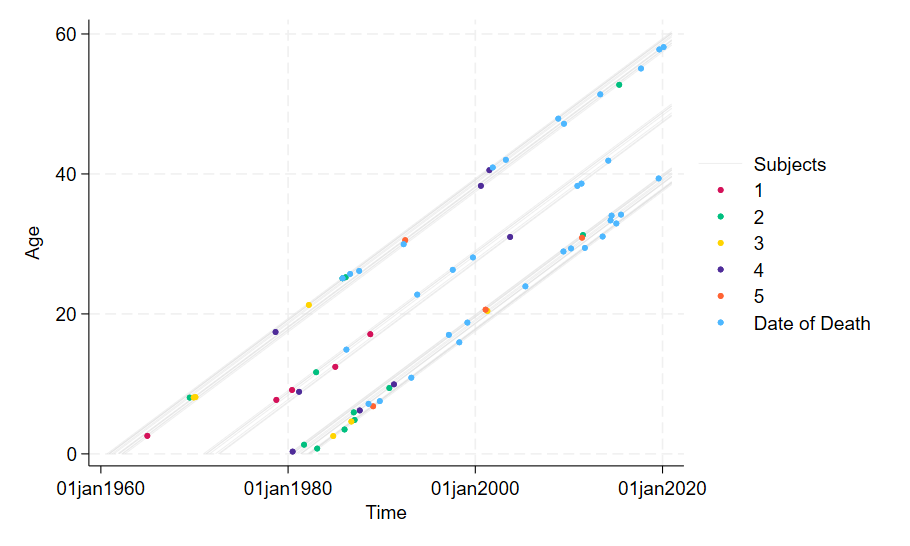
A Lexis plot is a two-dimensional diagram that represents the events in the lives of different groups of people. These events can be anything from birth up to and including death, depending on what you are trying to represent. This example includes the events of birth and death, as well as the event where one of five drugs was prescribed to the individuals. This example is tracking outcomes for several different drugs on different groups of people.
To create a Lexis plot in Stata you first need to download the evhistplot command from the SSC, which you can do from within Stata with the following command:
ssc install evhistplot
To generate this graph in Stata, use the following commands:
clear all
set obs 90
set seed 460386
generate dob = runiformint(td(1jan1960),td(31dec1962)) in 1/30
replace dob = runiformint(td(1jan1970),td(31dec1972)) in 31/60
replace dob = runiformint(td(1jan1980),td(31dec1982)) in 61/90
label variable dob "Date of Birth"
generate dod = runiformint(td(1jan1985),td(31dec2020))
label variable dod "Date of Death"
generate record\_date = runiformint(dob,dod)
label variable record\_date "Date Drug Dispensed"
generate patient\_id = \_n
label variable patient\_id "Patient ID Number"
generate drug\_type = runiformint(1,5)
label variable drug\_type "Type of Drug Prescribed"
evhistplot record\_date dod, id(patient\_id) start(1jan1960) end(31dec2020) evtype(drug\_type) birth(dob) nsub(35)