Add a Table to your Graph with the Graph Editor
You can use the graph editor to add and position text boxes to appear in table form on your graph. There are also many ways for you to easily reproduce these changes. You can record your changes and reapply them with the recording, or you can use the gr_edit command. The gr_edit command, when placed at the beginning of graph editor commands, will apply the same change in command form. To find your graph editor commands, you can open a .grec graph editor recording in a text editor, or if you have saved your graph as a .gph Stata graph, you can also open these .gph files in a text editor. The .gph files will have a bunch of nonsense characters at the start, but at the end of the file you should be able to see the editor commands.
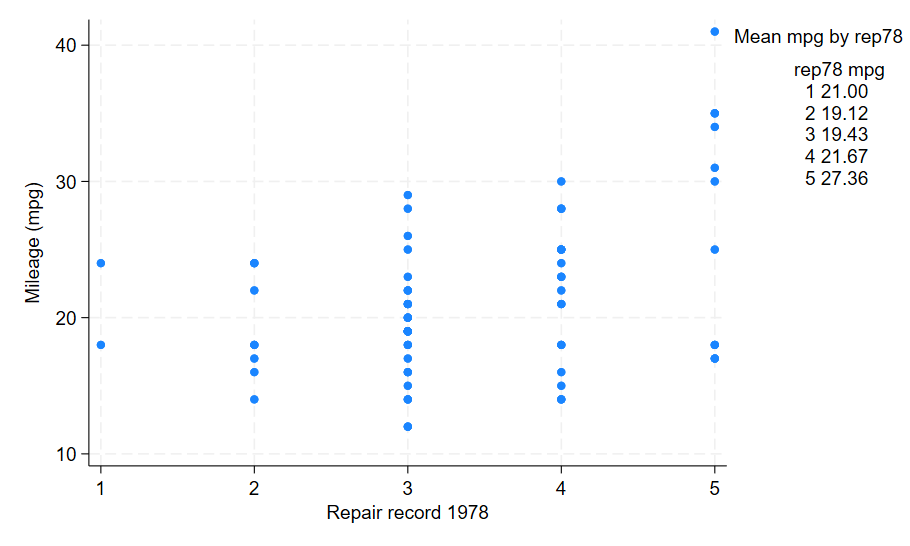
To generate this graph in Stata, use the following commands:
. sysuse auto, clear

. twoway (scatter mpg rep78), graphregion(margin(r+30))

. gr_edit AddTextBox added_text editor `=82+8' `=131'

. gr_edit added_text_new = 1

. gr_edit added_text_rec = 1

. gr_edit added_text[1].text = {}

. gr_edit added_text[1].text.Arrpush "Mean mpg by rep78"

. gr_edit AddTextBox added_text editor `=82+2' `=142'

. gr_edit added_text_new = 2

. gr_edit added_text_rec = 2

. gr_edit added_text[2].text = {}

. gr_edit added_text[2].text.Arrpush "rep78 mpg"

. collapse mpg, by(rep78)

. local z=2

. forvalues i=0/4 {
  2.         local ++z
  3.         gr_edit AddTextBox added_text editor `=80-(`i'*4)' `=145'
  4.         gr_edit added_text_new = `z'
  5.         gr_edit added_text_rec = `z'
  6.         gr_edit added_text[`z'].text = {}
  7.         gr_edit added_text[`z'].text.Arrpush "`=rep78[`z'-2]' `=string(mpg[`z'-2],"%8.2f")'"
  8. }