Automatically Generate Linear Axis Range in Stata
You can use the regaxis command in Stata to automatically create axis ranges and ticks for variables that you want to plot together. For example, you run the regaxis command on variable Y and have it generate a Stata local macro that contains a suggested range for the Y axis. You can then run your Stata graph command and use the generated local macro to give the Y axis range.
To use this command, you first need to download it from the SSC, which you can do in Stata using the following command:
ssc install regaxis
To generate this graph in Stata, use the following commands:
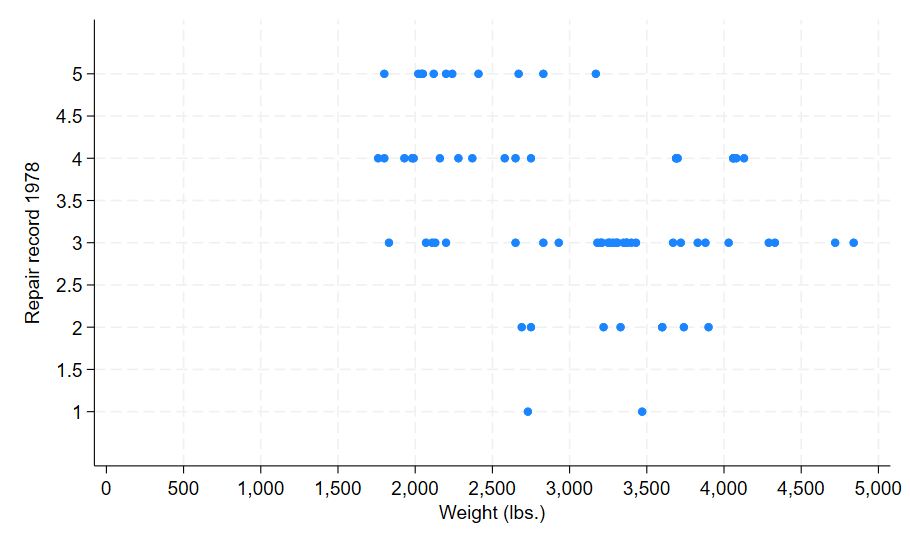
sysuse auto, clear
regaxis rep78, cycle(.5) singleok margin(0.5) lrange(yrange) lticks(ylabs)
regaxis weight, include(0) lticks(xlabs)
scatter rep78 weight, yscale(range(`yrange')) ylabel(`ylabs') xlabel(`xlabs')