Getting Started in Stata - Creating a Line Graph
Today we are going to show you how to create a line graph using both Stata menus and Stata commands. Graphics are an important tool for communicating data and results to others, as well as illustrating trends. The line graph is a common graph where you have an x (dependent) variable and a y (independent) variable and each observation forms part of a single line from left to right across the graph. You can use this graph to look at changes to data over time as well as compare changes over time between groups.
As a new Stata user it is recommended that you start by using the Stata menus to perform your analysis and create graphs. Each analysis or graphic, such as a t-test or scatter graph, will show up in your Review pane (on the left side of the Stata screen) as the equivalent Stata command. This allows you to begin learning the general structure of commands and how to use them. Once you become more familiar with commands you will find it is faster and easier to perform your analyses using commands.
I am going to use the Stata Example dataset uslifeexp.dta. I load this dataset using the following command:
sysuse uslifeexp.dta
Line Graph using Stata Menus:
Graphics > Twoway graph (scatter, line, etc.)

Click Create…

Select “Basic plots” from the list of plot categories
Select/highlight “Line” under “Basic plots: (select types)”
Select “le” as the Y variable and “year” as the X variable from the drop-down menus
Click “Accept”
Click “Submit”
Line Graph using Stata Commands:
twoway (line le year)
Output:
Using either the menus or commands, Stata produces the following graph:
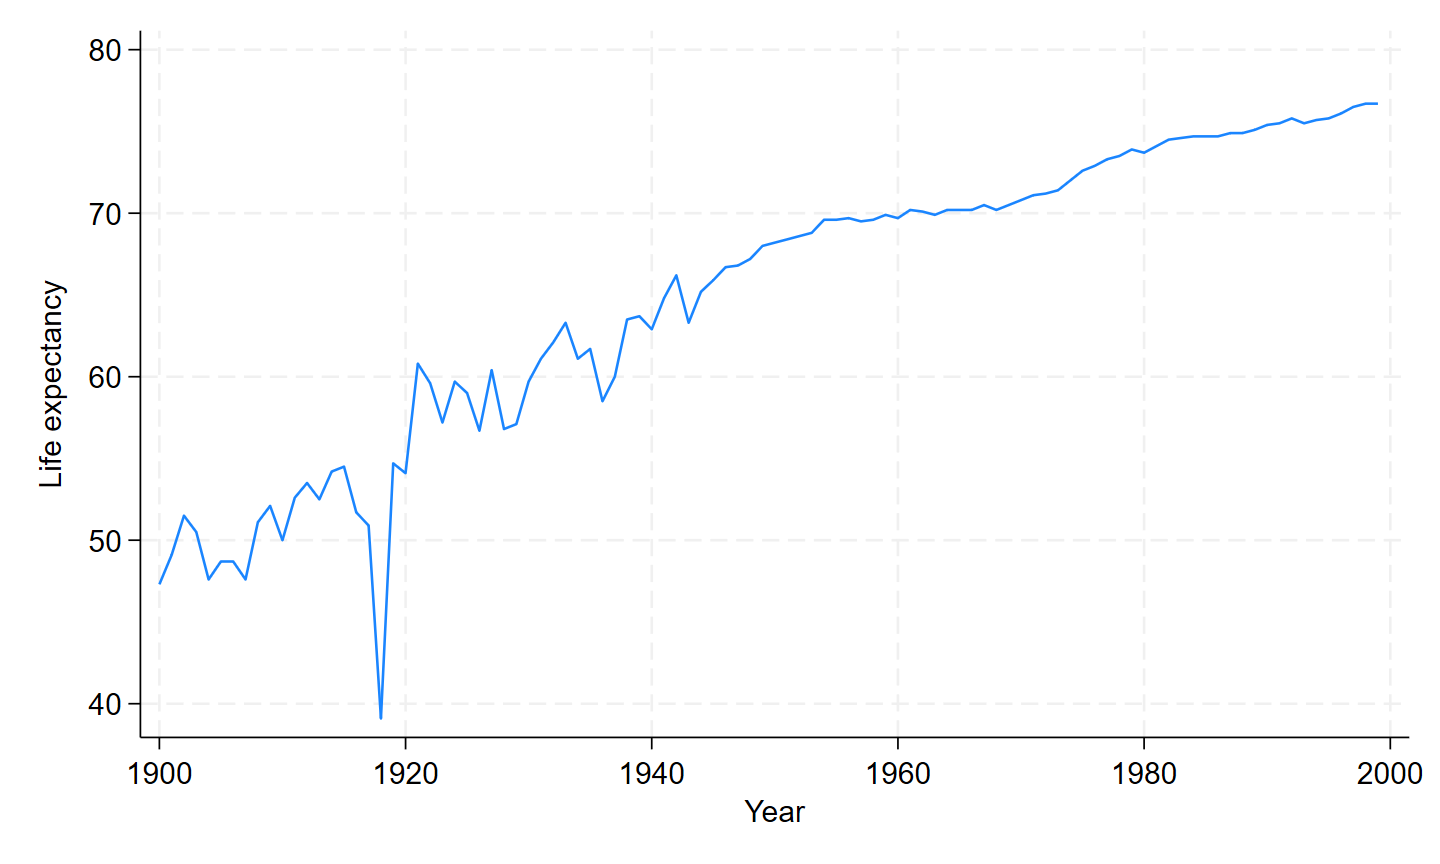
This line graph illustrates an upward trend in life expectancy over time. From 1900 to 2000 there has been a steady increase in overall life expectancy for all citizens of the United States of America. This line graph also highlights a significant dip in life expectancy from around 1915 to 1920. If we look at the numbers for just those six years (54.5, 51.7, 50.9, 39.1, 54.7, 54.1) we find the large drop is the result of one low result in 1918 with an average life expectancy of 39.1 years.