Scatter Plot with Linear Line of Best Fit
In Stata, to apply a line of best fit to a scatter graph you need to make two graphs together. However, there is also a command called aaplot that will do this for you. All you need to do is give the scatter variables and an appropriate line of best fit will be applied.
To create this graph in Stata, you first need to download the aaplot command from the SSC, using the following command in Stata:
ssc install aaplot
To generate this graph in Stata, use the following commands:
sysuse auto, clear
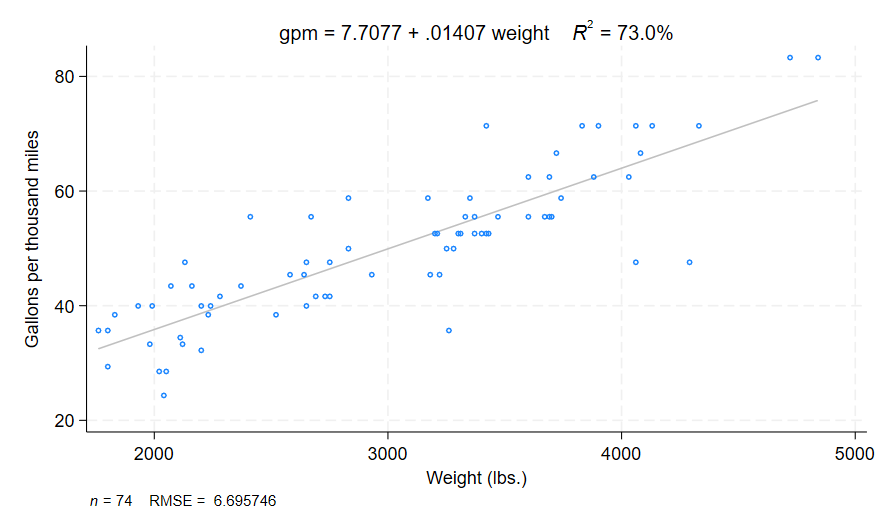
generate gpm = 1000 / mpg
label variable gpm "Gallons per thousand miles"
aaplot gpm weight