Exporting Tabulate Tables to Word with putdocx in Stata 15 and 16
This post is not applicable for Stata versions 17 or newer. To learn how to do this in a much easier way with the new and improved table command introduced in Stata 17, check out this blog post.
The putdocx command is a new addition in Stata 15 and updated in later versions, which allows you to create a word document entirely from within Stata. The command includes options for adding a table to the word document. There are three methods for adding a table, either using the data currently loaded in memory, a matrix, or an estimation result. For more information on how to add tables using these methods check out this Putdocx Command blog post.
To add simple summary tables for commands such as summarize, describe or tabulate we use Stata macros and returned results. In this post we demonstrate the use of two tabulate command options, one called matcell() which allows you to save the tabulate frequencies as a matrix, and one called matrow() which allows you to save the unique values of your variable as a matrix (the first column in tabulate’s output). Once saved as a matrix you can then add that matrix to a word document using the putdocx command.
How to Use:
For one-way tables:
tabulate var1 , matcell( matcell_matrix_name ) matrow( matrow_matrix_name )
matrix matrix_name = ( matrow_matrix_name , matcell_matrix_name )
matrix colnames matrix_name = var1 Frequency
putdocx clear
putdocx begin
putdocx table table_name = matrix( matrix_name ), colnames
putdocx save document name
For two-way tables:
tabulate var1 var2 , matcell( matcell_matrix_name ) matrow( matrow_matrix_name )
matrix matrix_name = ( matrow_matrix_name , matcell_matrix_name )
matrix colnames matrix_name = var1 var2_1_Freq var2_2_Freq var2_3_Freq ...
putdocx clear
putdocx begin
putdocx table table_name = matrix( matrix_name ), colnames
putdocx save document_name
Worked Example 1 - Oneway Tabulate:
For this example I am going to use the Stata example dataset auto.dta, and I am going to generate a one-way table of frequencies for the rep78 variable. This variable has 5 repair record ratings, with 1 being the worst and 5 being the best.
. sysuse auto, clear
(1978 automobile data)

. tabulate rep78, matcell(cell) matrow(row)

     Repair |
record 1978 |      Freq.     Percent        Cum.
------------+-----------------------------------
          1 |          2        2.90        2.90
          2 |          8       11.59       14.49
          3 |         30       43.48       57.97
          4 |         18       26.09       84.06
          5 |         11       15.94      100.00
------------+-----------------------------------
      Total |         69      100.00

. matrix rep78tab = (row, cell)

. matrix colnames rep78tab = rep78 Frequency

. putdocx clear

. putdocx begin

. putdocx table oneway = matrix(rep78tab), colnames

. putdocx save C:/Users/Public/oneway.docx, replace
successfully created "C:/Users/Public/oneway.docx"
This generates the following table saved to the MS Word document oneway.docx

Worked Example 2 - Twoway Tabulate:
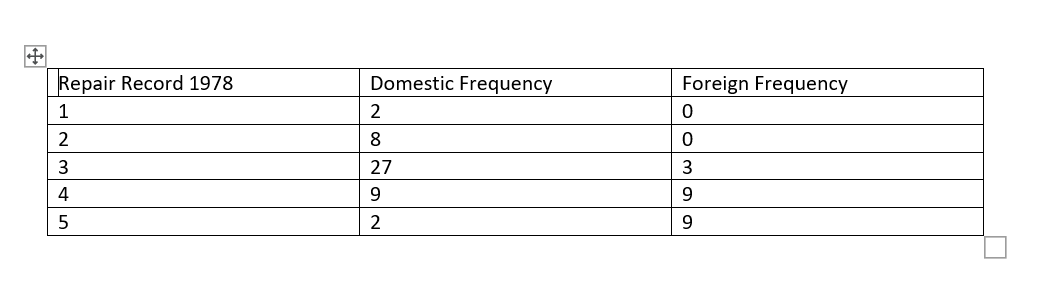
For this example I am going to generate a two-way frequency table of repair record (1-5) by country of manufacture (foreign or domestic) using the rep78 and foreign variables.
. sysuse auto, clear
(1978 automobile data)

. tabulate rep78 foreign, matcell(cell) matrow(row)

    Repair |
    record |      Car origin
      1978 |  Domestic    Foreign |     Total
-----------+----------------------+----------
         1 |         2          0 |         2
         2 |         8          0 |         8
         3 |        27          3 |        30
         4 |         9          9 |        18
         5 |         2          9 |        11
-----------+----------------------+----------
     Total |        48         21 |        69

. matrix repfortab = (row, cell)

. matrix colnames repfortab = "Repair Record 1978" "Domestic Frequency" "Foreign Frequency"

. putdocx clear

. putdocx begin

. putdocx table twoway = matrix(repfortab), colnames

. putdocx save C:/Users/Public/twoway.docx, replace
successfully created "C:/Users/Public/twoway.docx"
This generates the following table in MS Word document twoway.docx
Worked Example 3 - Percent and Cumulative Percent for Oneway Tabulate:
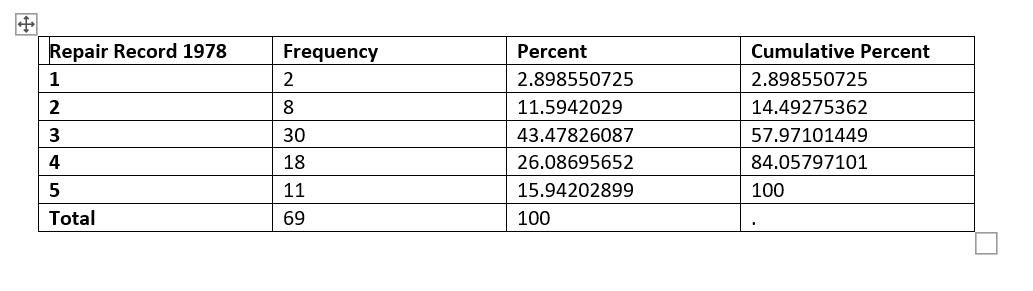
As you can see from example 1 the percent and the cumulative percent do not carry across when you use this matrix method. You can have these added to your table, but it requires a few extra steps which I will demonstrate in this example.
In this section I make use of macros. If you do not know about Stata macros I suggest you read the help file, which you can access using the command help macro. I will not cover them here, except to say that when calling a macro you use the opening quote or grave (located on the tilde ~ key on your keyboard) followed by the macro name and then a normal apostrophe single-quote (on the double-quote " key). If the code below does not work for you make sure you are calling the macros correctly.
If you have not used Stata matrices before, please pay careful attention to the slashes used in this code. For matrices in Stata a backwards slash is used to append two matrices together, while a forward slash is for division. If you run into errors trying to follow this example, check the direction of your slashes carefully.
. sysuse auto, clear
(1978 automobile data)

. tabulate rep78, matcell(cell) matrow(row)

     Repair |
record 1978 |      Freq.     Percent        Cum.
------------+-----------------------------------
          1 |          2        2.90        2.90
          2 |          8       11.59       14.49
          3 |         30       43.48       57.97
          4 |         18       26.09       84.06
          5 |         11       15.94      100.00
------------+-----------------------------------
      Total |         69      100.00

. matrix percent = (cell/r(N))*100

. local max = rowsof(cell)

. matrix cumulative = J(`max',1,cell[1,1])

. forvalues i = 2/`max' {
  2. matrix cumulative[`i',1] = cell[`i',1] + cumulative[`i'-1,1]
  3. }

. matrix cumulative = (cumulative/r(N))*100

. matrix rep78tab = (row,cell,percent,cumulative)

. matrix total = (.,r(N),100,.)

. matrix rep78tab = rep78tab\total

. local varlabel : variable label rep78

. matrix colnames rep78tab = "`varlabel'" Frequency Percent "Cumulative Percent"

. local max = rowsof(rep78tab) + 1

. putdocx clear

. putdocx begin

. putdocx table oneway = matrix(rep78tab), colnames

. putdocx table oneway(`max',1) = ("Total")

. putdocx table oneway(1,.), bold

. putdocx table oneway(.,1), bold

. putdocx save C:/Users/Public/oneway2.docx, replace
successfully created "C:/Users/Public/oneway2.docx"
This produces the following table in MS Word document oneway2.docx
Worked Example 4 - Total for Twoway Tabulate:
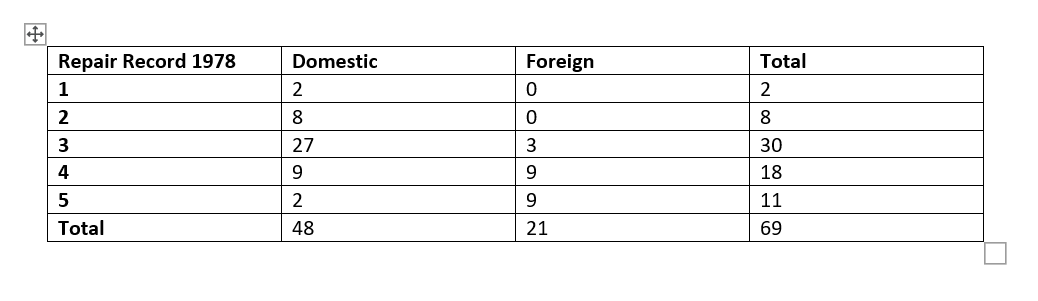
As you can see from example 2 the totals for a twoway table do not carry across when you use this matrix method. You can have the totals added to your table, but it requires a few extra steps which I will demonstrate in this example.
This section also uses macros and matrices, similar to example 3.
. sysuse auto, clear
(1978 automobile data)

. tabulate rep78 foreign, matcell(cell) matrow(row)

    Repair |
    record |      Car origin
      1978 |  Domestic    Foreign |     Total
-----------+----------------------+----------
         1 |         2          0 |         2
         2 |         8          0 |         8
         3 |        27          3 |        30
         4 |         9          9 |        18
         5 |         2          9 |        11
-----------+----------------------+----------
     Total |        48         21 |        69

. local cols = colsof(cell)

. matrix combine = J(`cols',1,1)

. matrix rowtotal = cell*combine

. matrix repfortab = (cell,rowtotal)

. local rows = rowsof(repfortab)

. matrix rcombine = J(1,`rows',1)

. matrix totals = rcombine*repfortab

. matrix totals = .,totals

. matrix repfortab = (row,repfortab)\totals

. local var2label = ""

. local valuelabel : value label foreign

. levelsof foreign, local(levels)
0 1

. foreach v of local levels {
  2. local lab : label `valuelabel' `v'
  3. local var2label = `"`var2label'"' + `""`lab'""' + " "
  4. }

. local varlabel : variable label rep78

. matrix colnames repfortab = `""`varlabel'""' `"`var2label'"' "Total"

. local rows = rowsof(repfortab) + 1

. putdocx clear

. putdocx begin

. putdocx table twoway = matrix(repfortab), colnames

. putdocx table twoway(`rows',1) = ("Total")

. putdocx table twoway(1,.), bold

. putdocx table twoway(.,1), bold

. putdocx save C:/Users/Public/twoway2.docx, replace
successfully created "C:/Users/Public/twoway2.docx"
This gives the following table in MS Word document twoway2.docx
I have designed the code in this example to work with unknowns. It would be faster to simply specify everything for this table, but in the long term I have created a code I can apply to any tabulate I run and only have to change the variable names. If I turned this into a do-file with arguments I wouldn’t need to change anything. The only change that may need to be made is if your secondary variable (foreign in this case) does not have value labels. If there are no value labels and just numbers, remove the line local valuelabel : value label foreign. Additionally, change the line within the foreach loop from local lab : label valuelabel v to just local lab = v.
While this may seem a bit involved, if you set it up as a do-file or personal program (ado-file) you can run this whenever you like without having to constantly rewrite the code.